If you’re among the majority of Americans, chances are you take a moment to scan the Nutrition Facts label before tossing an item into your cart. But here’s a sobering thought: estimates indicate that one in five people struggle to fully grasp what those numbers mean. Even those who feel confident might be falling into common traps, according to health experts. “The label’s straightforward appearance can trick consumers into seeing it as a clear, simple, and objective guide,” explains Xaq Frohlich, PhD, author of From Label to Table: Regulating Food in the Information Age. “Yet, the origins of those numbers are far from uniform.” To help you navigate this essential tool more effectively, let’s dive into three critical aspects that often trip people up.
1. The Daily Value Percentage Isn’t Tailored to You
That column showing percentages next to nutrients aims to give you a quick sense of whether a food might be a healthy option. While it serves a purpose, it comes with a significant caveat. The “% Daily Value” indicates what portion of the recommended daily intake is provided in a single serving. However, don’t make the mistake of assuming those percentages align perfectly with your personal needs. They’re based on a standardized diet of 2,000 calories per day, which doesn’t account for individual variations.
In reality, your calorie requirements depend on factors like age, height, weight, and activity level. For example, using the USDA’s intake calculator, an active 50-year-old woman who is 5’7″ and weighs 120 pounds needs about 2,100 calories daily, but if she weighs 190 pounds, that jumps to 2,500 calories. A very active 50-year-old man who is 6 feet tall and 180 pounds requires approximately 3,350 calories, while a 35-year-old breastfeeding woman at 5’5″ and 170 pounds needs around 2,600 calories. Given this wide range, the Daily Values on labels might be significantly higher or lower than what your body actually requires.
Instead of getting bogged down in exact percentages, adopt a broader approach that works regardless of your calorie needs. Consider a food low in a nutrient if it provides 5% or less of the Daily Value, and high if it reaches 20% or more. Most individuals should aim for foods higher in fiber, vitamin D, calcium, iron, and potassium, while limiting those high in saturated fat, sodium, and added sugars. “Take a can of artichokes as an example,” says Hope Barkoukis, PhD, chair of the nutrition department at Case Western Reserve University School of Medicine. “If it shows around 20% for sodium, you can still enjoy it, but recognize it’s a high source. On the flip side, if it lists 4% for total carbohydrates, that indicates a low source.”
2. Those Numbers Aren’t as Precise as They Seem
At first glance, the Nutrition Facts label appears packed with exact figures, leading many to trust them implicitly. But here’s a surprise: by law, there’s considerable flexibility in these numbers. For nutrients we’re advised to limit—such as calories, sugars, saturated fat, and sodium—the actual content can be up to 20% higher than what’s listed. Conversely, for other naturally occurring nutrients, the amount might be as much as 20% lower. Only added nutrients, like those in fortified foods, must be reported accurately.
This leeway exists because manufacturers can’t guarantee consistency in every batch. A package of frozen vegetables, for instance, won’t have identical nutrient levels each time. Even the 2,000-calorie baseline and its associated Daily Values are somewhat imprecise. “The decision-makers chose 2,000 as a round number, assuming people would understand it wasn’t exact but easy to work with,” Frohlich notes. “It looks like a precise tool, but it’s designed with the recognition that people use it in approximate ways.”
The Daily Value itself derives from two different data sets. The Recommended Dietary Allowance (RDA) reflects the average daily amount needed by nearly all healthy individuals, while the Adequate Intake (AI) is an estimate used when research is insufficient to establish precise requirements. On nutrition labels, the DV often aligns with the RDA or AI, but not always. Yes, it can be confusing, and no, you shouldn’t treat these numbers as guarantees. As Frohlich points out, they were never meant to be. Instead of crunching exact numbers, think in general terms—like high versus low—and use the label to compare similar products for better choices.
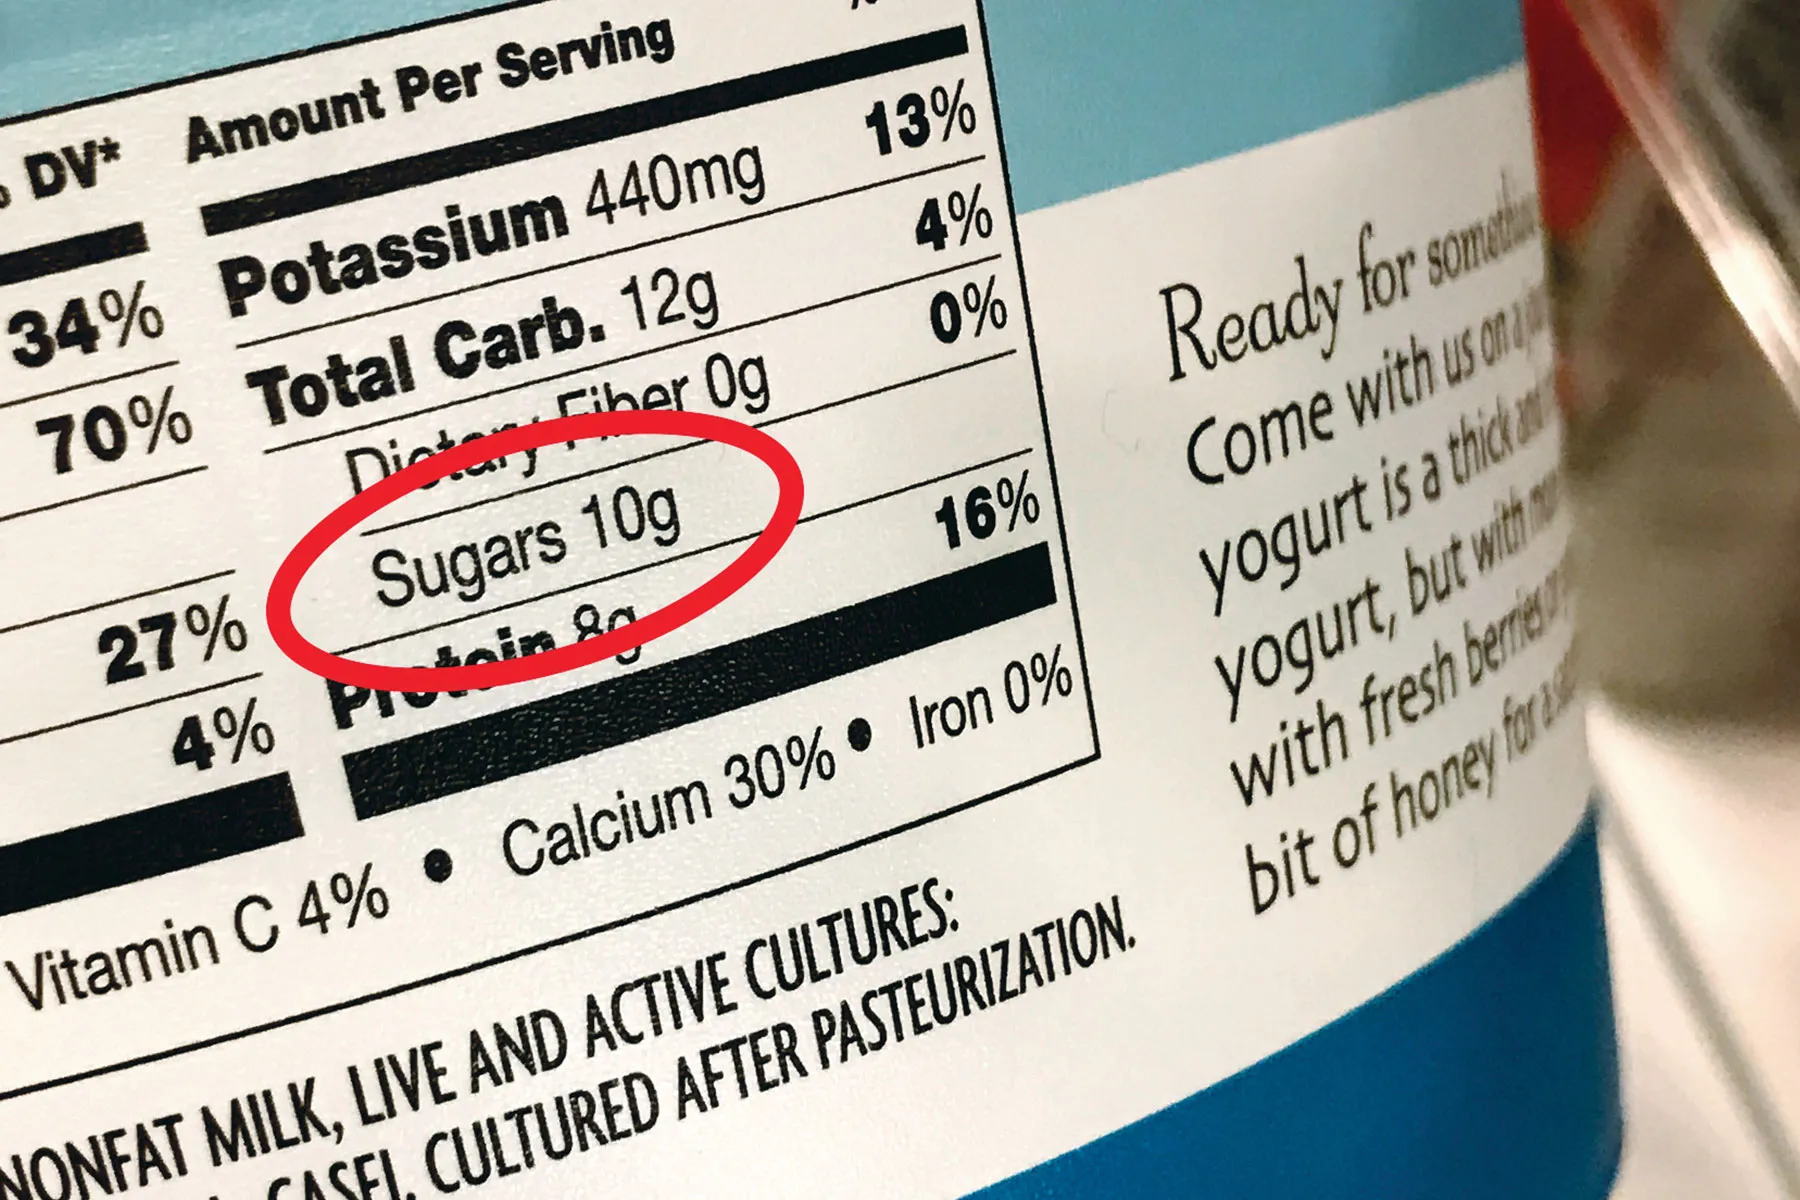
3. Pay Attention to Both Sugar Categories
Under the Total Carbohydrates section, you’ll typically find two entries for sugar: Total Sugars and Added Sugars. Unless a healthcare professional has specifically advised you to monitor total sugar grams, it’s the Added Sugars number that deserves your focus. “I’ve seen people look at a milk label and declare, ‘I can’t drink milk,’” shares Joan Salge Blake, EdD, a dietitian, nutrition professor at Boston University, and host of the Spot On! podcast. “They don’t realize milk contains lactose, a natural sugar, with no added sugars. This confusion even occurs among my nutrition students, who should know better.”
The latest Dietary Guidelines for Americans emphasize this distinction, recommending that no single meal contribute more than 10 grams of added sugar. By zeroing in on Added Sugars, you can make more informed decisions that support your health goals without unnecessarily avoiding nutritious foods like dairy or fruits.
By keeping these insights in mind, you can transform the Nutrition Facts label from a source of confusion into a practical tool for healthier eating. Remember, it’s not about perfection but about making better-informed choices one label at a time.